Chart.js to Image
---
[](https://www.npmjs.com/package/chartjs-to-image)
[](https://www.npmjs.com/package/chartjs-to-image)
[](https://app.travis-ci.com/typpo/chartjs-to-image)
This is a wrapper for exporting Chart.js as an image. It works on the server side as well as client side (although on the client you may prefer to use [toBase64Image](https://quickchart.io/documentation/chart-js/image-export/#use-tobase64image-in-the-browser)).
The renderer is based on QuickChart, a free and open-source web service for generating static charts. View the main QuickChart repository [here](https://github.com/typpo/quickchart).
# Installation
If you are using npm:
```
npm install chartjs-to-image
```
# Usage
This library provides a **ChartJsImage** object. Import it, instantiate it, and set your [Chart.js](https://www.chartjs.org) config:
```js
const ChartJsImage = require('chartjs-to-image');
const myChart = new ChartJsImage();
myChart.setConfig({
type: 'bar',
data: { labels: ['Hello world', 'Foo bar'], datasets: [{ label: 'Foo', data: [1, 2] }] },
});
```
Write the image to disk:
```js
myChart.toFile('/tmp/mychart.png');
```
Convert it to a data URL:
```js
const dataUrl = await myChart.toDataUrl();
```
Or get a buffer that contains your chart image:
```js
const buf = await myChart.toBinary();
```
ChartJsImage supports some additional functions using a third party rendering service. Use `getUrl()` on your ChartJsImage object to obtain a URL that will display your chart when visited:
```js
console.log(myChart.getUrl());
// Prints: https://quickchart.io/chart?c=%7Btype%3A%27bar%27%2Cdata%3A%7Blabels%3A%5B%27Hello+world%27%2C%27Foo+bar%27%5D%2Cdatasets%3A%5B%7Blabel%3A%27Foo%27%2Cdata%3A%5B1%2C2%5D%7D%5D%7D%7D&w=500&h=300&bkg=transparent&f=png
```
For larger charts, you may not want to encode the chart in the URL. Use `getShortUrl()` to get a fixed-length URL:
```js
const url = await myChart.getShortUrl();
console.log(url);
// Prints: https://quickchart.io/chart/render/f-a1d3e804-dfea-442c-88b0-9801b9808401
```
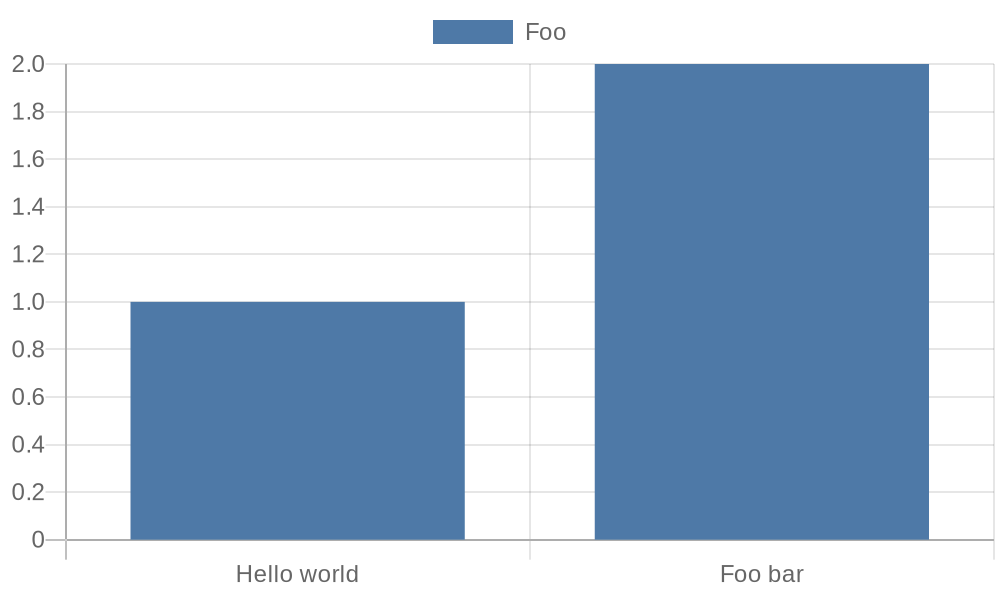
All the above examples create this following Chart.js image:
 ## Customizing your chart
### setConfig(chart)
Use this config to customize the Chart.js config object that defines your chart. You must set this before creating any outputs!
### setChartJsVersion(version: string)
Sets the version of Chart.js to use. Defaults to the latest version of Chart.js v2. Other valid version settings include: "3", "4", "3.9.1", "4.1.1", etc.
### setWidth(width: int)
Sets the width of the chart in pixels. Defaults to 500.
### setHeight(height: int)
Sets the height of the chart in pixels. Defaults to 300.
### setFormat(format: string)
Sets the format of the chart. Defaults to `png`. `svg` and `webp` are also valid.
### setBackgroundColor(color: string)
Sets the background color of the chart. Any valid HTML color works. Defaults to `#ffffff` (white). Also takes `rgb`, `rgba`, and `hsl` values.
### setDevicePixelRatio(ratio: float)
Sets the device pixel ratio of the chart. This will multiply the number of pixels by the value. This is usually used for retina displays. Defaults to 1.0.
## Getting outputs
There are two ways to get a URL for your chart object.
### getUrl(): string
Returns a URL that will display the chart image when loaded.
### getShortUrl(): Promise
Uses the quickchart.io web service to create a fixed-length chart URL that displays the chart image. The Promise resolves with a URL such as `https://quickchart.io/chart/render/f-a1d3e804-dfea-442c-88b0-9801b9808401`.
Note that short URLs expire after a few days for users of the free service. You can [subscribe](https://quickchart.io/pricing/) to keep them around longer.
### toBinary(): Promise
Creates a binary buffer that contains your chart image.
### toDataUrl(): Promise
Returns a base 64 data URL beginning with `data:image/png;base64`.
### toFile(pathOrDescriptor: string): Promise
Creates a file containing your chart image.
## More examples
Check out the `examples/` directory to see other usage. Here's a simple test that uses some of the custom parameters:
```js
const chart = new ChartJsImage();
chart.setConfig({
type: 'bar',
data: { labels: ['Hello world', 'Foo bar'], datasets: [{ label: 'Foo', data: [1, 2] }] },
});
chart.setWidth(500).setHeight(300).setBackgroundColor('transparent');
console.log(chart.getUrl());
// https://quickchart.io/chart?c=%7Btype%3A%27bar%27%2Cdata%3A%7Blabels%3A%5B%27Hello+world%27%2C%27Foo+bar%27%5D%2Cdatasets%3A%5B%7Blabel%3A%27Foo%27%2Cdata%3A%5B1%2C2%5D%7D%5D%7D%7D&w=500&h=300&bkg=transparent&f=png
chart.toFile('/tmp/test.png')
```
Here's a more complicated chart that includes some Javascript:
```js
chart.setConfig({
type: 'bar',
data: {
labels: ['January', 'February', 'March', 'April', 'May'],
datasets: [
{
label: 'Dogs',
data: [50, 60, 70, 180, 190],
},
],
},
options: {
scales: {
yAxes: [
{
ticks: {
callback: function (value) {
return '$' + value;
},
},
},
],
},
},
});
chart.setWidth(500).setHeight(300).setBackgroundColor('#0febc2');
const buf = await chart.toBinary();
```
## Customizing your chart
### setConfig(chart)
Use this config to customize the Chart.js config object that defines your chart. You must set this before creating any outputs!
### setChartJsVersion(version: string)
Sets the version of Chart.js to use. Defaults to the latest version of Chart.js v2. Other valid version settings include: "3", "4", "3.9.1", "4.1.1", etc.
### setWidth(width: int)
Sets the width of the chart in pixels. Defaults to 500.
### setHeight(height: int)
Sets the height of the chart in pixels. Defaults to 300.
### setFormat(format: string)
Sets the format of the chart. Defaults to `png`. `svg` and `webp` are also valid.
### setBackgroundColor(color: string)
Sets the background color of the chart. Any valid HTML color works. Defaults to `#ffffff` (white). Also takes `rgb`, `rgba`, and `hsl` values.
### setDevicePixelRatio(ratio: float)
Sets the device pixel ratio of the chart. This will multiply the number of pixels by the value. This is usually used for retina displays. Defaults to 1.0.
## Getting outputs
There are two ways to get a URL for your chart object.
### getUrl(): string
Returns a URL that will display the chart image when loaded.
### getShortUrl(): Promise
Uses the quickchart.io web service to create a fixed-length chart URL that displays the chart image. The Promise resolves with a URL such as `https://quickchart.io/chart/render/f-a1d3e804-dfea-442c-88b0-9801b9808401`.
Note that short URLs expire after a few days for users of the free service. You can [subscribe](https://quickchart.io/pricing/) to keep them around longer.
### toBinary(): Promise
Creates a binary buffer that contains your chart image.
### toDataUrl(): Promise
Returns a base 64 data URL beginning with `data:image/png;base64`.
### toFile(pathOrDescriptor: string): Promise
Creates a file containing your chart image.
## More examples
Check out the `examples/` directory to see other usage. Here's a simple test that uses some of the custom parameters:
```js
const chart = new ChartJsImage();
chart.setConfig({
type: 'bar',
data: { labels: ['Hello world', 'Foo bar'], datasets: [{ label: 'Foo', data: [1, 2] }] },
});
chart.setWidth(500).setHeight(300).setBackgroundColor('transparent');
console.log(chart.getUrl());
// https://quickchart.io/chart?c=%7Btype%3A%27bar%27%2Cdata%3A%7Blabels%3A%5B%27Hello+world%27%2C%27Foo+bar%27%5D%2Cdatasets%3A%5B%7Blabel%3A%27Foo%27%2Cdata%3A%5B1%2C2%5D%7D%5D%7D%7D&w=500&h=300&bkg=transparent&f=png
chart.toFile('/tmp/test.png')
```
Here's a more complicated chart that includes some Javascript:
```js
chart.setConfig({
type: 'bar',
data: {
labels: ['January', 'February', 'March', 'April', 'May'],
datasets: [
{
label: 'Dogs',
data: [50, 60, 70, 180, 190],
},
],
},
options: {
scales: {
yAxes: [
{
ticks: {
callback: function (value) {
return '$' + value;
},
},
},
],
},
},
});
chart.setWidth(500).setHeight(300).setBackgroundColor('#0febc2');
const buf = await chart.toBinary();
```